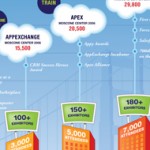
The cloud computing industry event of the year, Dreamforce ’11 (#DF11), kicks-off next month. To celebrate, we partnered once again with Eloqua to create an infographic that gives a visual history of the event.
The cloud computing industry event of the year, Dreamforce ’11 (#DF11), kicks-off next month. To celebrate, we partnered once again with Eloqua to create an infographic that gives a visual history of the event.
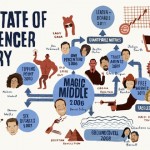
From Moses’ clay tablets, to the Old Spice Guy, to Fred Wilson’s blog, influencers have been influencin’ since the dawn of time.

JESS3 partnered with GE to create an infographic that visualizes the devastating impact of Healthcare Associated Infections (HAIs). HAIs are the most common complication of hospital care and a relatively unknown killer.
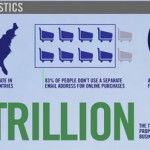
31% of hacks originate in the U.S., where 83% of folks do not use a separate email address for online purchases. Maybe that’s why 73% of Americans have fallen victim to cyber crimes of one kind or another. Yikes.
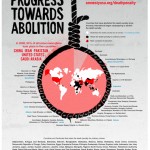
Late this spring, the Nobel Prize-winning organization Amnesty International celebrated its 50th anniversary. Here at JESS3, we were honored with the opportunity to distill 50 magnificent years of accomplishments into one infographic, outlining Amnesty’s storied history. Additionally, we produced four more infographics dedicated to Amnesty’s work. One detailed the U.S. maternal health care crisis, including sharp […]

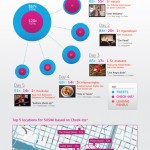
Every 60 seconds, there are over 13,000 iPhone applications downloaded, around 600 new videos added to YouTube, over 70 domains registered, more than 60 new blogs launched, almost 700,000 searches on Google, and 168 million emails sent.

It feels like it was just yesterday that we released the first version of The Content Grid with Eloqua. I remember it particularly clearly because pitching it was my very first project as JESS3’s newest hire last June. At the time, the infographic seemed incredibly complex to me, so I broke it down in terms that I thought anyone would be able to digest, regardless of their level of experience in content marketing: “The Content Grid is a visual guideline that plots out two things: 1) who should create content and 2) how it should be distributed for the biggest sales impact.”
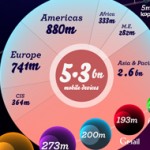
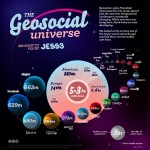
In August of 2010, the JESS3 team launched The Geosocial Universe 1.0 to determine who the biggest players were in the location-based landscape. Since then, acquisitions, mergers and IPOs have happened, so we decided it needed an update. The Geosocial Universe 2.0 pairs a new a design that better displays the comparison between the total […]
It seems like it was just yesterday that the JESS3 team was in Austin, soaking in rays of Texas sunshine, scarfing down breakfast tacos and listening in on amazing panels from our industry’s brightest.
![]() by Jesse Thomas
by Jesse Thomas
Because things change so quickly in the world of the wide web, we’ve decided to give a little update to one of our favorite project from last Summer, The Geosocial Universe Infographic.