Tag: infographic

6 Bad Digital Habits Infographics

It’s hard to imagine a world without internet anymore. We rely on it for everything from term papers to cat pictures. And as any histrionic think piece will tell you, that’s exactly why we’re all doomed. In fact, for 60% of things, it’s ruining everything. Okay, that wasn’t a real statistic. And the internet isn’t […]

24 startup ideas that VCs are begging to fund

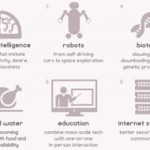
Looking to build a business, but not sure what it should do, or if the concept you have is viable? Startup incubator Y Combinator is here to help. Their Fundable Ideas list lays out today’s problems most in need of solutions. Naturally, Y Combinator also looking for things that aren’t on this list; as they […]

Apocalypse When?

Awesome infographic alert! You might have heard that we love infographics, and today we’re loving this one from the BBC. Although “loving” may be the wrong word when we’re talking about the apocalypse. Source: http://www.bbc.com/future/story/20141230-apocalypse-when

A Wonderful Night for a Braindance

PLES MOŽGANOV, or “Braindance”, is an experiment bridging the gap between science and art. 20 volunteers were put into a black box with no stimuli except for sound, and as their brainwaves were measured, they listened to an audio track they had never heard before. The experiment drew from how much the listener could concentrate, […]

The Do’s & Don’ts of Making an Infographic

Utilizing infographics to tie visual design and data together is what we do best, and we’re gonna let you in on the secret to our success! Here are the Do’s and Don’ts of creating an awesome infographic! JESS3 Presents – The Dos & Donts of Making an Infographic from JESS3

Scrolling through the Story: An Interactive Feature to Information

We’ve been particularly intrigued lately by sites that make use of infinite scroll to create stories that are both interactive and beautiful. Whether they present their data chronologically or in a taxonomy of ideas, these infographics combine a multitude of data processing to help the viewer absorb the information in stages. Innovative and fresh, we’ve chosen three that we believe do a first-class job of piecing up the data bit by bit.

What Makes a Good Infographic? Part 2 – Design Structure

Is there a secret recipe for a strong infographic? Recently, we discussed this idea with some of our peers in the Society of Digital Agencies (SoDA). Yesterday, in “What Makes a Good Infographic? Part 1,” our Associate Creative Director for Editorial, Simon Steinhardt, looked at infographics from an editorial angle. Today I’ll be talking design.

JESS3 is LeWeb’s Official Visualization Partner

JESS3 is honored this week to join many of the world’s most renowned thinkers, companies and entrepreneurs at this year’s LeWeb conference in Paris. Working closely with our Art Director Jim Hollander (SKWAK), I will be creative directing a series of visualizations that encapsulate data from Radian6 and insights from each of the panels.

How JESS3 Drove 200,000 Views to a Video

With the breadth, depth and trustworthiness to warrant billions of pageviews monthly, Wikipedia is a cause célèbre in the techy community. It began with fits and starts, but has since blossomed to become a place where anyone at any time can settle (almost) any bet. Tracing the meteoric rise of Wikipedia over its first 10 […]