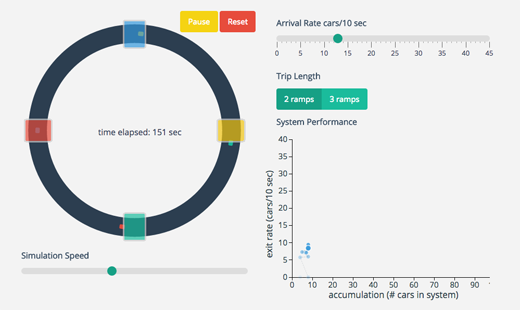
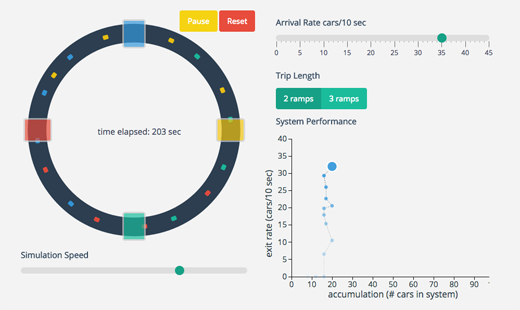
Setosa specializes in something close to JESS3’s heart: data visualization. Or as they prefer to call it, visual explanations. In a remarkable first, they’ve managed to explain the difference between a bottleneck and full-on gridlock in a way that actually got us interested. Their interactive traffic simulationis in depth, interactive, and interesting – and it does all that while looking amazing. Check it out here.


Source:
http://setosa.io/blog/2014/09/02/gridlock/
Tags: bottleneck, gridlock
Join the Conversation