Because things change so quickly in the world of the wide web, we’ve decided to give a little update to one of our favorite project from last Summer, The Geosocial Universe Infographic.
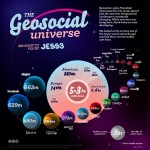
The Geosocial Universe 2.0
![]() by Jesse Thomas
by Jesse Thomas
![]() by Jesse Thomas
by Jesse Thomas
Because things change so quickly in the world of the wide web, we’ve decided to give a little update to one of our favorite project from last Summer, The Geosocial Universe Infographic.

Our latest release is another partnership with GE, a follow up to our “Future of Solar” visualization released earlier this month. The Tower Bridge Infographic outlines the history of one of London’s most recognizable landmarks from its opening over 100 years ago, in 1894 to present day, where the bridge sees as many as 40,000 […]
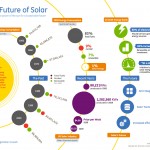
In an effort to better educate its costumers on its projects and innovations, GE has been releasing a number of informative data visualizations on its blog this year. In this newest JESS3-designed release which falls under their “Ecomagination” category, the graphic tells the story of solar power – its past, present and future. Renewable energy […]
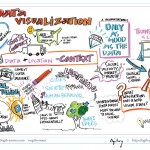
Yesterday, our panel, “Social Media Data Visualization: Mapping the World’s Conversations” had the honor of being one of the panels at SXSWi chosen by Ogilvy Notes to illustrate in real time. The result is a snackable illustration by Nora Herting of what was discussed by Adam Bly, Benjamin Wiederkehr, Eric Friedman, and our own Robin […]

![]() by Jesse Thomas
by Jesse Thomas
A brief synopsis of Edward Tufte’s workshop, “Presenting Data and Information”, courtesy of 37signals. Also check out Tony Colley’s detailed notes; I found them very helpful.