Tag: infographics

Information Design: If Glenn Beck Can Do It, You Can Do It

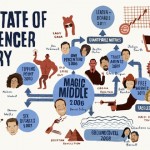
On Wednesday night, I was invited to speak on one of the least talked about topics on the web right now: Infographics. And by least, I actually mean most. “If you take away just one thing from my talk tonight let it be this,” I said to a packed house on Ogilvy PR’s 10th floor, […]

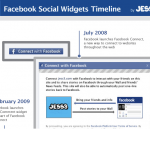
Facebook’s Social Widgets Timeline [Infographic]

Facebook’s “Like” button recently celebrated its first birthday—noting that 10,000 sites are integrating with the social plugin daily. A week ago, the evolution of sharing widgets continued with the launch of the “Send” button.

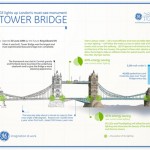
The Tower Bridge Infographic for GE

Our latest release is another partnership with GE, a follow up to our “Future of Solar” visualization released earlier this month. The Tower Bridge Infographic outlines the history of one of London’s most recognizable landmarks from its opening over 100 years ago, in 1894 to present day, where the bridge sees as many as 40,000 […]

Survey: how women really feel about Facebook

Not only is Facebook a great resource it can also be a stress for some. A recent survey by Eversave asked 400 women about their Facebook relationships. They found a surprising love/hate relationship between woman and their friends. Read the Mashable post here.

The Message is the Messenger

As an accompaniment to the upcoming SXSW Interactive panel by the same name, Eloqua and JESS3 have put together The Message is the Messenger infographic which examines how influence has shifted to the individual over the last few years. (click here to download large format pdf) Taking a modern twist on a Venn diagram, this […]

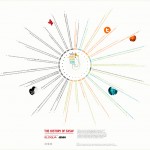
The History of SXSW

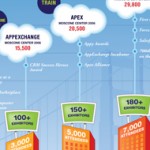
Ever wonder how SXSW became the cultural behemoth it is today? Partnering again with Eloqua, we’ve assembled some of the most interesting facts about the Austin-based festival since it came into existence some 25 years ago. The History of SXSW infographic also maps out the immense growth in attendance over the past few years of […]