Tag: infographics

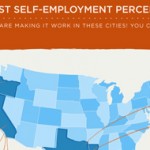
The Best Freelance Cities in the USA

It’s that time again! Today’s infographic has some interesting stats on freelancing, and definitely told us a few things we wouldn’t have guessed about the freelance life. Check it out! Does this infographic reflect your experiences as a freelancer? Source: http://www.creativebloq.com/career/are-these-best-cities-live-freelancer-41514625 

The Do’s & Don’ts of Making an Infographic

Utilizing infographics to tie visual design and data together is what we do best, and we’re gonna let you in on the secret to our success! Here are the Do’s and Don’ts of creating an awesome infographic! JESS3 Presents – The Dos & Donts of Making an Infographic from JESS3

The Graphic Account: April 17, 2013

Talk about big data! This week we found a map of the Internet, an infographic of the loneliest islands on Earth, and a visualization of the distance to Mars in pixels. We think you’ll also get a kick out of a video game based on infographics and Persian rugs made from Google Maps images.

The Graphic Account: March 14, 2013

From antique cartography to personalized logs, lots of beautiful connections mapped out this week! We also found visualizations that make sense of mythological relationships, suss out the virality of content, and a font like none other.

The Geosocial Universe 3.0

In August 2010, JESS3 took one giant step for social with the introduction of The Geosocial Universe infographic. Last year, the map got updated. And now, with changes to the social landscape occurring at lightspeed, JESS3 presents its third iteration of The Geosocial Universe.

The Graphic Account: February 1, 2013

With a new book release from Nathan Yau, two visualizations that examine the word choice of inaugural addresses, and a chart of sci-fi book covers, this edition of the Graphic Account gets literary. Along with being a bit bookish, look out for the most elegant solution to bus schedules that public transit could ever hope for.