This week we discovered that Fantine from Les Miz coughs more than any other character, Raiders of the Lost Ark looks a little like a Family Circus cartoon, and that Canada’s leaders are the most educated in the world.

This week we discovered that Fantine from Les Miz coughs more than any other character, Raiders of the Lost Ark looks a little like a Family Circus cartoon, and that Canada’s leaders are the most educated in the world.

Running up to their big Storytelling Lab Day this October, Ogilvy London asked some of its key partners to come in and talk about the many different aspects of storytelling week-by-week in the form of a Lab Lunch. This past week JESS3’s information design director, Tiffany, presented to the Ogilvy team all about visual storytelling with data.
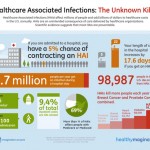
JESS3 partnered with GE to create an infographic that visualizes the devastating impact of Healthcare Associated Infections (HAIs). HAIs are the most common complication of hospital care and a relatively unknown killer.