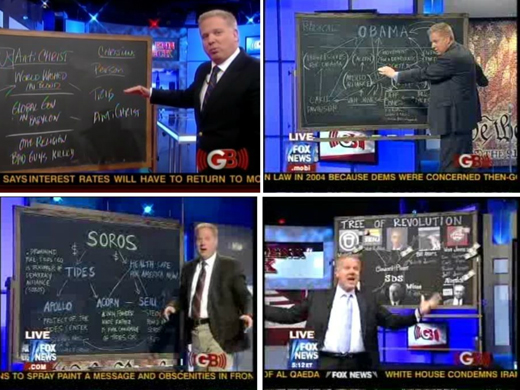
On Wednesday night, I was invited to speak on one of the least talked about topics on the web right now: Infographics. And by least, I actually mean most.
“If you take away just one thing from my talk tonight let it be this,” I said to a packed house on Ogilvy PR’s 10th floor, “if Glenn Beck can be be an information designer, so too can you.” I said this because Glenn Beck makes information more accessible by adding academic integrity through chalk and a chalkboard (something Jesse pointed out to me months back and having seen it in action, completely agree). I said this also because at JESS3 we believe the human race has been using information design to communicate for centuries. From communicating military rank, to personal expression, you can see data-driven storytelling everywhere:
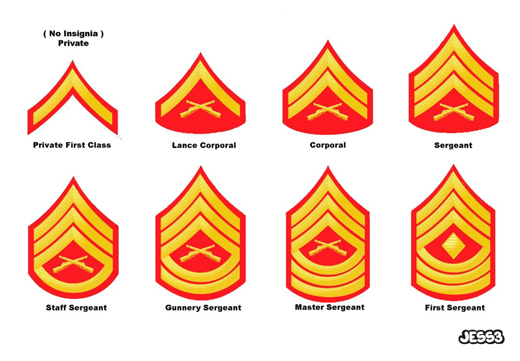

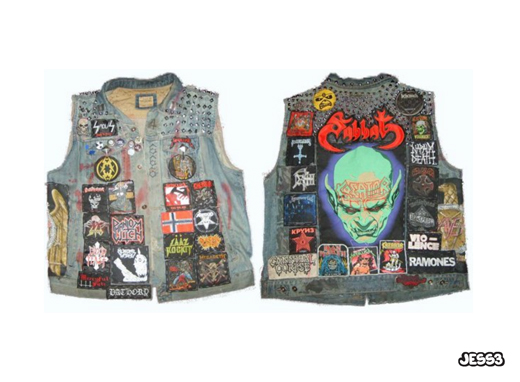
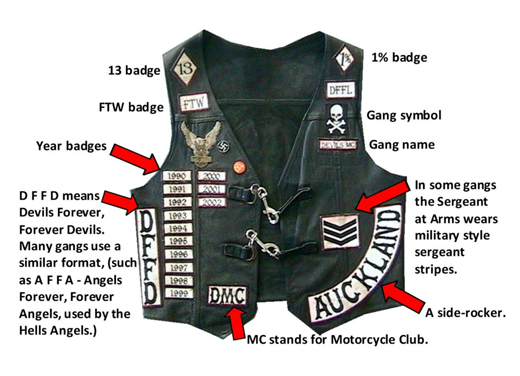
(More great examples in Jesse’s presentation: Data Visualization Meets Visual Storytelling)
What convinced me to come out was not the chance to talk about infographics even more than I do every day (blergh), but instead to participate in my first DC Web Women speaking gig (yay! love them!), share the Gospel of infographics with the DC community and learn from two information designers in the local ecosystem (shouts to designers Aaron Murphy, who serves as an Associate Creative Director at Ogilvy PR’s DI group and Will Carroll, who is the Principal and Founder of Geoill).
Aptly named “No More Boring Charts! Or Data Visualization in DC” (#infographicsdc), Aaron kicked things off by providing us all structure around the various types of infographics. Three of the five that I could recall (and that seemed to stand out to me) were: Statistical, Process / System, Conceptual. I enjoyed the examples he provided, as I found myself nodding a lot. Up next, Will took data about the five largest orange-producing countries and visualized it in a variety of formats: heat map, pie chart, bar chart, bubbles… oh my! Although the information was the same in every graph, the visual vehicle that was chosen impacted how engaging and clear the information was. Huzzah!
It was also wonderful to catch up with favorite DC gal pals Shana Glickfield, Jill Foster, Melanie Spring, Kristin Wesley, Sibyl Edwards and Shireen Mitchell. They helped create an atmosphere of support, comfort and humor. Could’t have asked for a better time!
Interested in reliving the event even more? A few of my favorite tweets that came across the transom:
@devonvsmith: @lesliebradshaw: “my gmail doesn’t believe curation is a word, but I think it’s the future” #infographicsdc
@BeekeeperGroup: Steps to creating an infographic: Identify goals, gather data, find trends, choose type, design, refine! #InfographicsDC
@socialmediadc: Infographics aren’t NEW! @lesliebradshaw’s showing us pics of bumper stickers & patches. This is data visualization! #infographicsdc
@frankrebecca: @lesliebradshaw from @JESS3 bringing the cultural knowledge to #infographicsDC
@saedwards: Last night’s #infographicsDC panel was amazing! BIG KUDOS to @lesliebradshaw, @geoill & @ogilvypr for bringin’ on the awesome!
@kristendwesley: @Jess3’s @lesliebradshaw rocked the house last night at #infographicsDC (I even think there was cheering!)
Tags: datavisualization, dcwebwomen, infographics, infographicsdc, lesliebradshaw
Join the Conversation