There is no shortage of newsworthy events that emerge from the France’s LeWeb conference every year. Whether it’s Google’s Eric Schmidt predicting that Android will soon overtake Apple’s iOS, Spotify funder and Napster founder Sean Parker opining on the future of digital music, or Twitter’s Ryan Sarver defending the platform’s latest redesign, this year’s conference has served up a smorgasbord of quotable quotes for tech-hungry news consumers.
We at JESS3 decided to take it a step further, wondering, “What if we could capture the essence of each day at the LeWeb conference in a single infographic?”
Our Process:
- We collaborated with the LeWeb organizers and social media monitoring company Radian6, using its rich data to pepper numbers and statistics into our illustrations.
- Throughout the day, JESS3’s researchers have been watching panels (in person and via UStream) and mining them for newsworthy information.
- Our researchers are recording their notes in a single Google Doc and preparing briefs that our design team then interprets in visual form.
- We produce two illustrations for each day: (1) one includes all the speakers and their major takeways / topics and (2) one that, after the Radian6 data comes in, includes key trends and volumetric insights about the day’s conversations.
The end product is part word cloud, part infographic, and part illustration. Here’s one of our finalized graphics from the first day.
(click to enlarge)

Key Takeaways from Day 1:
- There were 26% more social media mentions of LeWeb ’11 than LeWeb ’10.
- 27% of the attendees are female versus 73% male.
- Only 30% of LeWeb attendees are from France. 37% are from the US.
- There were 26,777 social media mentions of LeWeb just on the first day.
- Karl Lagerfeld has four iPhones and upwards of 40 iPads. The real amazing thing is he has multiple iPods that serve as moments in time; he never erases them. He’s a smooth criminal. During a demonstration Lagerfeld sketched a portrait of Steve Jobs.
- Foursquare, the location-sharing site, that has now more than 15 million users, over 4 million check-ins daily, and is the hub of 600,000 merchants.
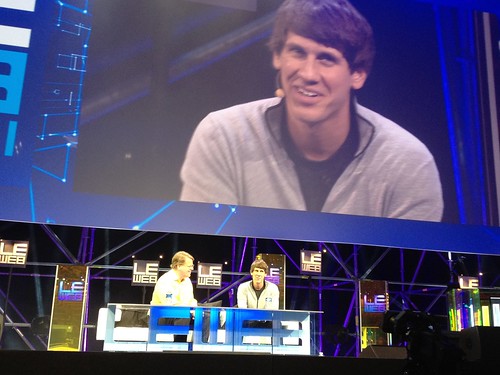
- Eric Schmidt from Google presented a demo of Ice Cream Sandwich, their newest Android platform, which will use facial recognition as security.
Obviously, visualizing an entire conference in real-time is a monumental task — incorporating multiple panels and then feeding in fresh social media data. To do this, we often produce an initial set of graphics and then update them with data when it’s newly available. So a graphic, in its early form, is almost pure illustration, and evolves into a more data-heavy infographic as the day goes on. Below, you’ll find out final infographic for Day 2 including the data provided to us by Radian6 (click to enlarge):

Day three of LeWeb just wrapped up moments ago and already the tech media is being bombarded with new newsworthy morsels. Twitter announced it has a 7 billion user goal, Spotify is adding a radio app, and TomTom is introducing an in-car, Android tablet (as they shed 10% of their workforce and refocus on R&D). JESS3’s researchers are dutifully jotting these bombshells down with fervor, and you can be sure they’ll be reflected in tomorrow’s JESS3 graphics.
[UPDATED]
Day 3 has been completed with data collected by the organizers and Radian6 (click to enlarge.)

Stay tuned this week for the final graphic that will include the entire event’s zeitgeist, as well as data about conversation, trends and what it took to make LeWeb happen.
[Disclosure: Google and foursquare are clients of JESS3.]
[Originally posted on Forbes.]
Tags: conference, Data Visualization, foursquare, france, google, illustration, infographic, jesse thomas, leweb, tech
Join the Conversation